Debugging - DataSpell
PyCharm IDE has always been my to-go IDE, and it’s debugger is pretty easy to use. In Jupyter notebook there’s a handy breakpoint that I used a lot.
I’ve tried DataSpell a while ago when it first released, but ultimately went back to Jupyter notebook since it’s plotly support was lagging.
However the newer version of DataSpell seems to be able to output most of the plotly plots.
To my surprise, the debugger works almost like a PyCharm debugger except the console which doesn’t seem to be able to create a python environment, but the debugger seems to work pretty well.
It’s seems to be able to support a few modes of operation.
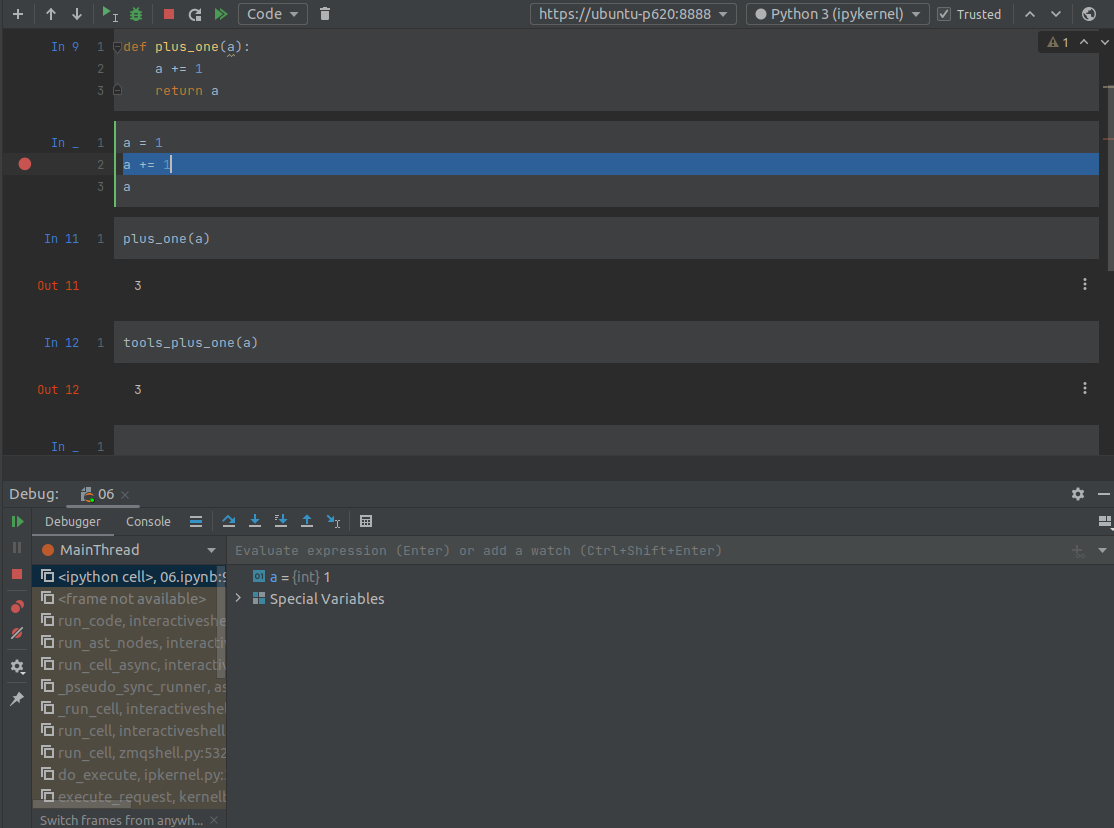
- Debugging on the current cell.
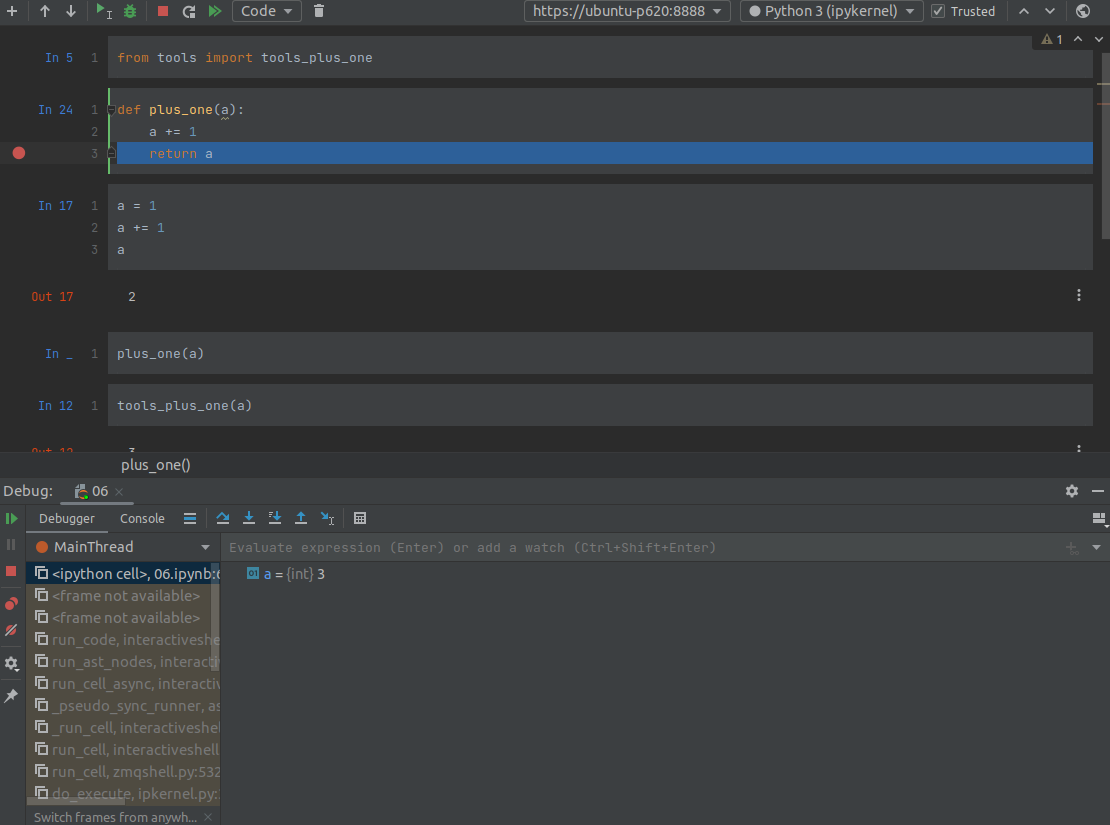
- Debugging another.
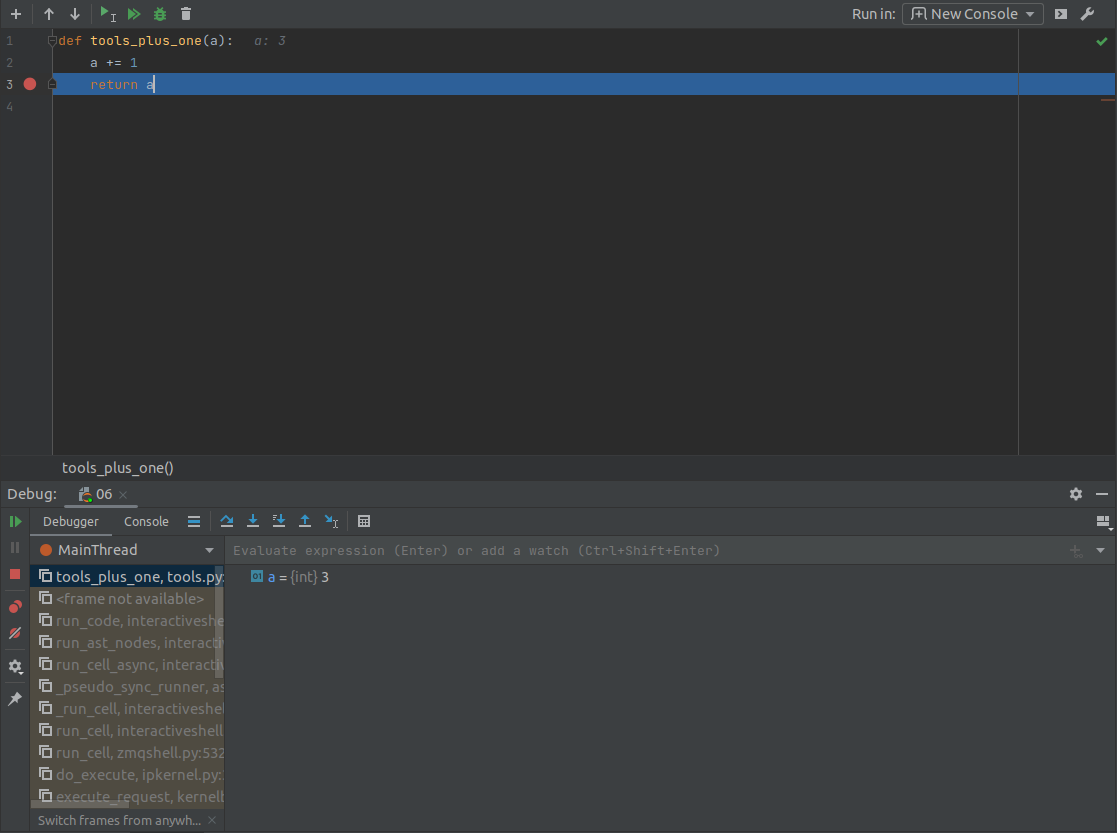
- Debugging another imported modules.
Example script:
from tools import tools_plus_one

def plus_one(a):
    a += 1
    return a

# Method 1
a = 1
a += 1

# Method 2
plus_one(a)

# Method 3
tools_plus_one(a)
Some examples: 1. Debugging current cell:
- Debugging another function.
- Debugging another imported modules.